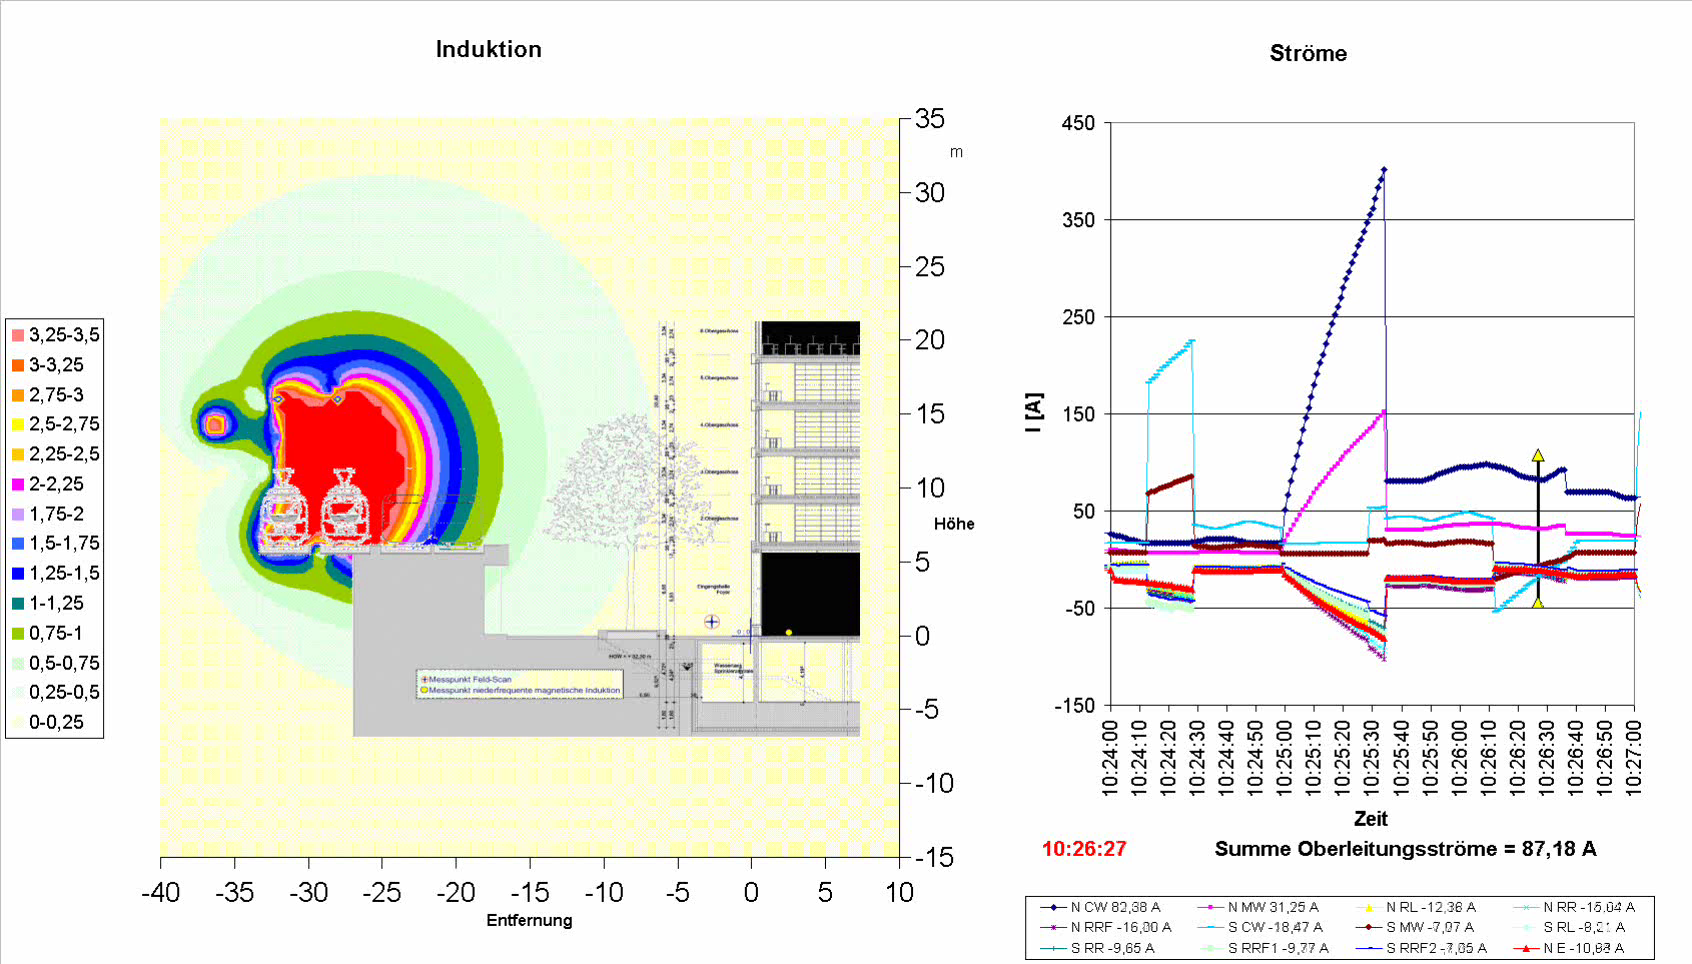
Videoclip about the behavior of magnetic flux density at a specific location versus time
This movie
was generated in post processing taking the simulation results of an
OpenPowerNet simulation. Unfortunately the labels are only in German
but anyways pictures say more than words.
The diagram on the left is the magnetic flux density and on the ride side the current of each conductor. The conductors represent the rails, contact wires, messenger wires, feeder and return cables. All together not less than 12 conductors.
BACK